Illinois maps Heading link
This series of maps displays data from the National Center for Farmworker Health (NCFH). For more data like this, including data for other states, visit the NCFH website.
For an interactive version of these maps with a pointer hover function, please download the Excel file HERE.
Farmworkers per county
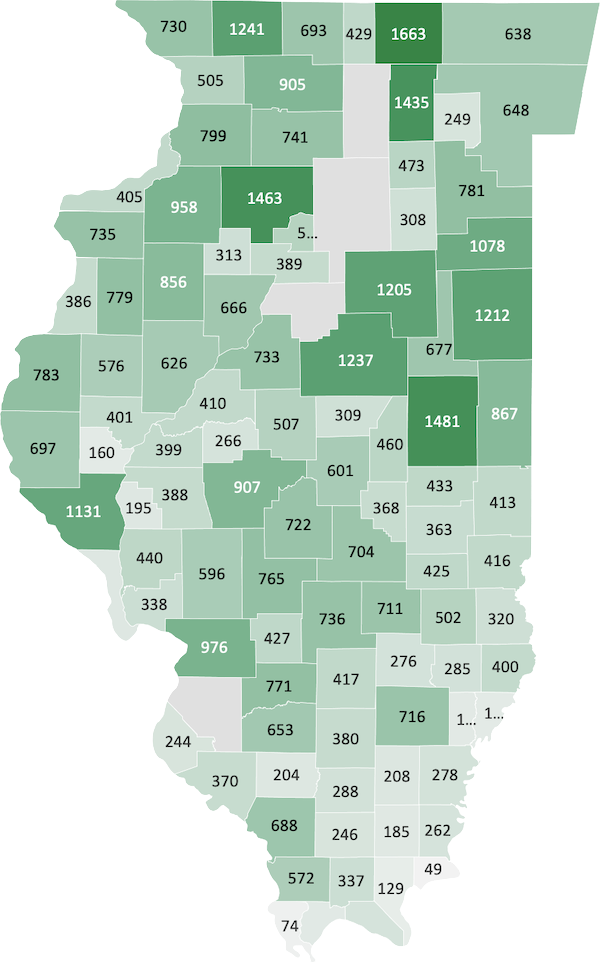
Estimated number of farmworkers per county
Lowest: 49 (Hardin)
Highest: 1,663 (McHenry)
Mean: 578.6
Median: 487.5
Farmworkers and dependents per county

Estimated number of farmworkers and their dependents per county
Lowest: 116 (Hardin)
Highest: 3,941 (McHenry)
Mean: 1,336.2
Median: 1,121
Farmworkers and dependents by population
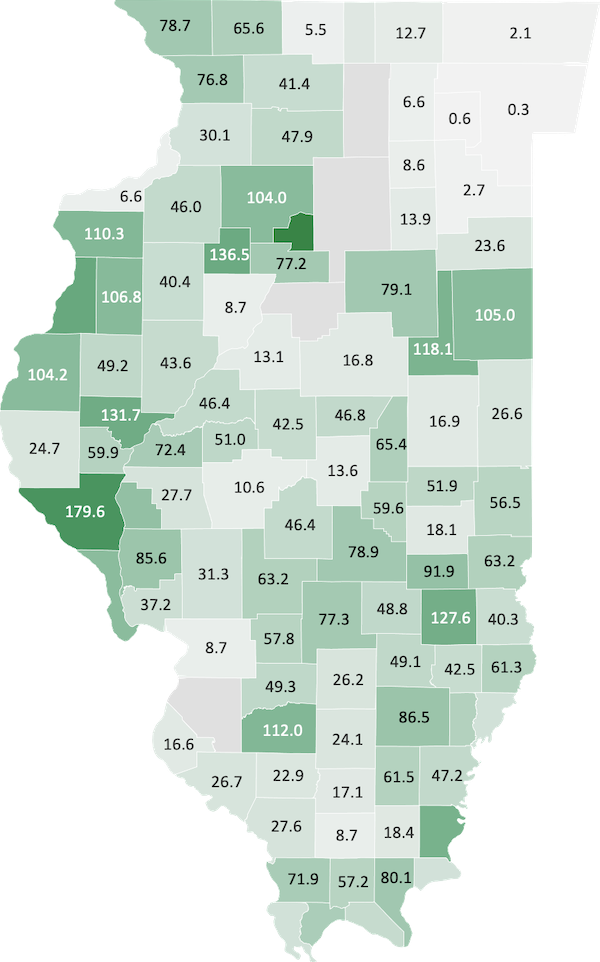
Estimated number of farmworkers and their dependents per 1,000 people
Lowest: 0.3 (Cook)
Highest: 211.1. (Putnam)
Mean: 54.1
Median: 47.0